viz.
Visual Rhetoric - Visual Culture - Pedagogy
Site informationRecent Blog Posts
|
political rhetoricHow USA Really Voted on November 6
Submitted by Chris Ortiz y P... on Sat, 2012-11-17 10:10
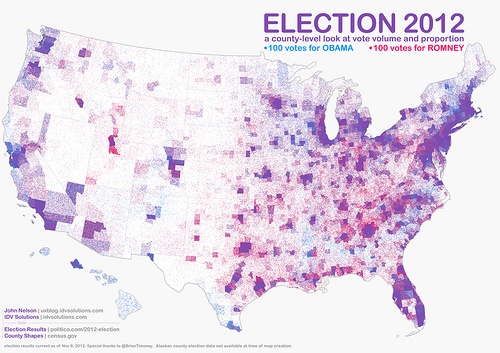
Image Credit: IDV Solutions What a wonderful map! This IS the popular vote on November 6, 2012. John Nelson gave us this map, and we thank him for it. It's called a "pointillist map:" one blue dot for every 100 votes for President Obama, randomly distributed in the county in which the votes were cast. One red dot for every 100 votes for Mr. Romney. You've heard of purple states? Well here's our purple country. Click the link on the image credit to find a large and hi-def version of this map. Then meet me back here, won't you?
Colorful Geographies of Beliefs
Submitted by Calliope on Fri, 2012-11-16 14:31
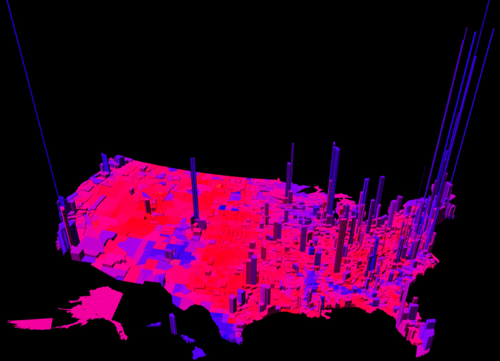
Image Credit: MIT Technology Review This electoral map, created by Princeton mathematician Robert J. Vanderbei, uses a spectrum of colors between blue and red to represent the ratio per county of Democrat to Republican votes. The height of the verticals indicate the number of votes in each county. Vanderbei's representation of the U.S. votes by region accounts for nuances in the data that other red-and-blue-state maps miss: the political dividedness of certain counties, the intensity of partisanship in others, and centers of strong voter turn out. From a visual standpoint, the map is eye-catching because it is purple. Purple is not a color usually associated with political belief. But other data crunchers, looking to complicate our picture of national voting trends, have unveiled maps this year with a similar palette. See my fellow viz. contributer Chris Ortiz y Prentice's post for an electoral map that also reveals (through pointillism instead of 3-dimensional modelling) the nation's purplish complexion. It might be mere coincidence that Chris and I both decided to write about visualizing ideological regionalism; but it's possible that our posts register an increasing need to redraw and redefine assumptions about voter demographics. That said, I'll leave the actual work of redefinition up to political analysts and turn to the far more obscure aims of this entry: to discuss the rhetorical role of color in images that chart belief systems and controversial policies.
I Turn My Camera On, Then My Photoshop
Submitted by Rachel Schneider on Fri, 2012-04-27 00:51
Image Credit: Everett Hiller H/T: Crushable While I’ve done some recent fangirling over Ryan Gosling and Benjamin Franklin, I would have never imagined I could be in a photograph with them. At least, not until I saw Everett Hiller’s holiday party photographs, into which he Photoshopped various celebrities. Panem et Circenses: The Hunger Games and Kony2012
Submitted by David A. Harper on Wed, 2012-03-28 22:31
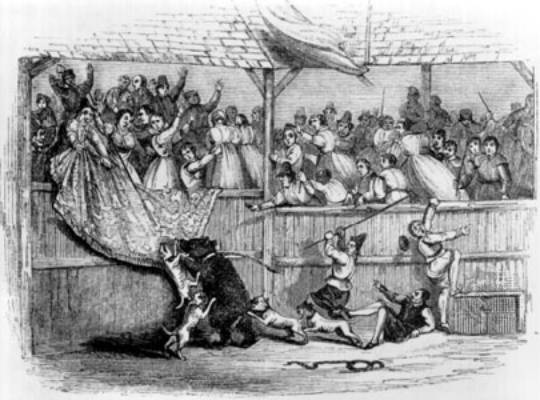
Image Credit: BookDrum.com I suspect I was one of very few people thinking of the First Earl of Shaftesbury, Anthony Cooper, as I watched The Hunger Games with my family last weekend. In particular, I was recalling how Shaftesbury lamented in 1711 that the English theater had come to resemble the “popular circus or bear-garden.”
The City upon a Hill at Halftime: Detroit, Unions, and the USA
Submitted by Rachel Schneider on Sun, 2012-02-12 17:43
Image Credit: Screenshot from YouTube While baseball is more my sport, I haven’t missed watching the Super Bowl for the last couple of years. If nothing else, I enjoy analyzing the Super Bowl commercials—and this year’s Chrysler commercial featuring Clint Eastwood presents an irresistible opportunity to discuss some interesting controversies. Both conservative critics like Karl Rove and the Wall Street Journal’s Steve Goldstein and liberal ones like Michael Moore and Charles Mudede have read the commercial as promoting Obama’s reelection campaign. The ad’s copy and visuals directly connect the fates of Detroit and the auto industry with larger economic and political trends, as you can see: The SOPA/PIPA Blackout: Two Ecologies of Discussion
Submitted by Ty Alyea on Tue, 2012-01-24 01:08
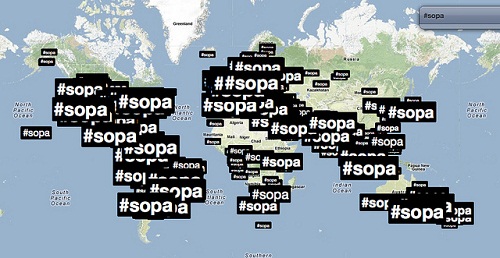 As we discussed yesterday, January 18's SOPA "blackout" generated a massive reaction that catalyzed a collapse in legislative support for the Congressional Stop Online Piracy Act (SOPA) and the Senate's Protect Intellectual Property Act (PIPA). Today, I will explore how some analysts are currently using images to depict SOPA's notoriety on the web during the blackout and, additionally, chart out SOPA/PIPA's relative obscurity in the realm of primetime television news before the blackout. Tags:
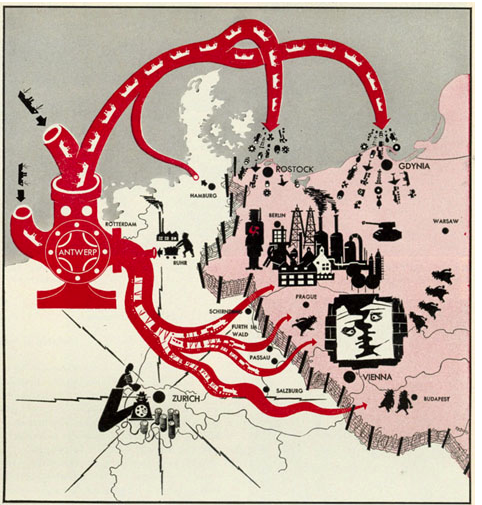
The Octopus of Antwerp and Other Cold War Maps: Critical Cartographies I
Submitted by Jake Ptacek on Tue, 2011-11-01 08:00
Image: Life Magazine via Newberry Library This is not the post I meant to write. My graduate research has increasingly involved reference to Charles Booth's Life and Labour of the People in London, a magisterial attempt to combine statistical data and cartography into an analysis of late-nineteenth century urban London experience. I had intended to post on Booth's groundbreaking "poverty maps", and the updated maps created by the London School of Economics (you can see their side-by-side comparison here). In my research for the post, though, I came across John Krygier's Making Maps blog, and I've become fascinated (and sidetracked) by the surprising power of cartography. Inspired to think about how maps and mapmaking critically constructs the world, what follows is a subjective and fairly non-rigorous tour of Western cartography during the Cold War era. Cairo and Perspective
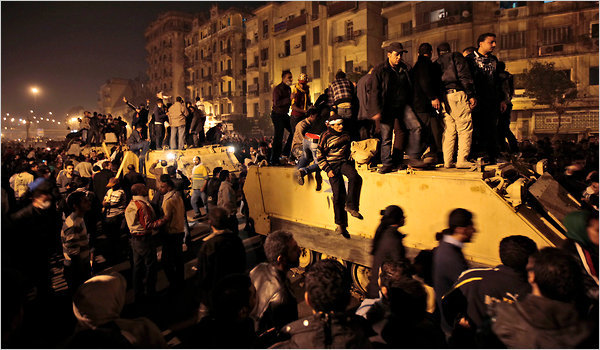
Submitted by noelradley on Sun, 2011-01-30 13:44
Lefteris Pitarakis Via New York Times Since protests began one week ago across Egypt, the media has published many photographs of iconoclasm against images of President Mubarak, or images depicting the scale of the protests in Cairo. I'd like to raise the question of how representative images from this week are using one-point and two-point perspective, and how that perspective informs our sense of the unfolding events. Launching into our semester with BagNewsNotes
Submitted by noelradley on Sun, 2011-01-23 21:49
Image Via BagNewsNotes We on the viz. team are researchers & instructors at the University of Texas, interested in all things visual. With the return to blogging for the spring semester, we'd like to begin by introducing BagNewsNotes, a site doing vital work to deconstruct the visuality of contemporary political news. White House, Green House
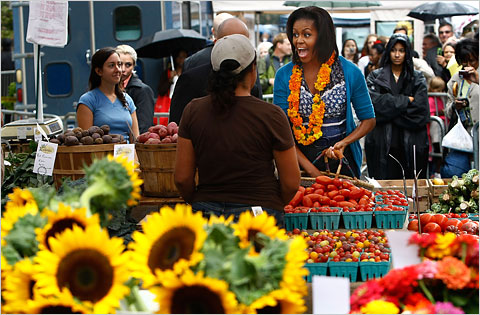
Submitted by EmilyBloom on Tue, 2009-09-22 16:30
Nestled between the white monuments of Washington D.C. is a new dash of green. On September 17th, Washington D.C. opened a weekly farmer's market near the White House. This opening, ceremoniously attended by Michelle Obama as well as hundreds of shoppers, led me to think about the ways in which the First Lady has championed the sustainability movement. One of her first ceremonial acts as a resident of 1600 Pennsylvania Avenue was to plant a garden. The White House website includes a film about digging this garden and compares Michelle Obama to Eleanor Roosevelt, the only other First Lady to plant produce on the White House lawns. In her remarks at the opening of the Farmer's Market, Michelle Obama refers to the White House gardens as "one of the greatest things that I've done in my life so far" and describes supporting the Farmer's Market as an extension of her commitment to making healthy food more widely accessible. |
|


Recent comments
2 years 29 weeks ago
2 years 44 weeks ago
2 years 44 weeks ago
2 years 50 weeks ago
3 years 4 weeks ago
3 years 4 weeks ago
3 years 4 weeks ago
3 years 6 weeks ago
3 years 6 weeks ago
3 years 6 weeks ago