viz.
Visual Rhetoric - Visual Culture - Pedagogy
Site informationRecent Blog Posts
|
We're Watching You - Google Analytics and viz. Readership
Submitted by Cate Blouke on Thu, 2011-05-05 18:34
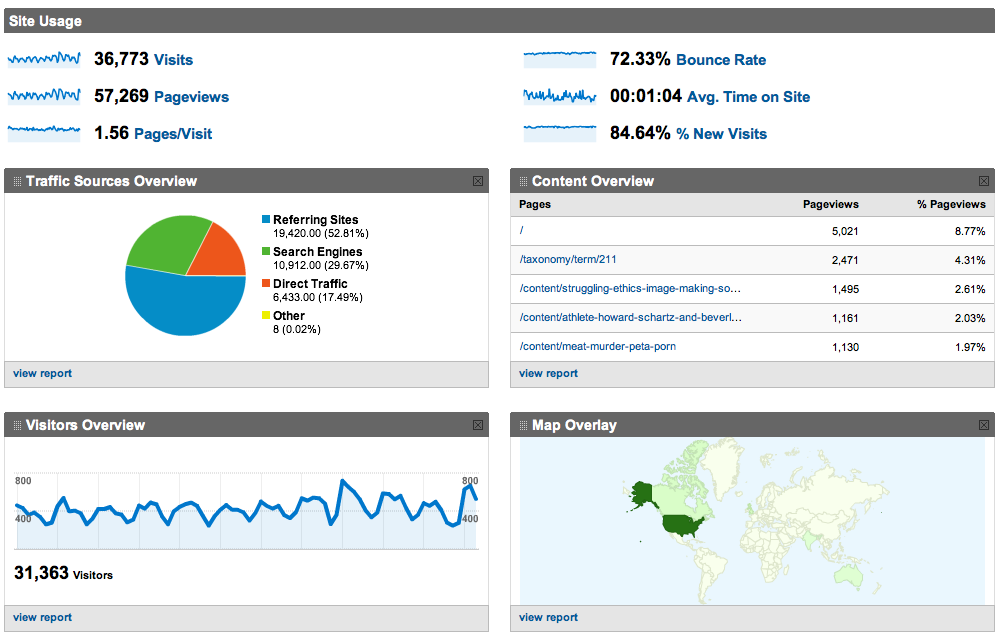
Screen Shot of Google Analytics dashboard view for viz. Earlier this semester, we here at viz. decided it might be nice to get a better sense of who we were talking to. As good rhetoricians, we felt it might be pertinent to know more about our audience. So we installed the handy-dandy (free) Google Analytics tool for tracking all sorts of information about our readership. The results have been surprising at times, reassuring on the whole, and ultimately quite useful for thinking about how better to serve you, our readers. The following is a discussion of both Google Analytics itself and the trends we've noticed on our site over the past few months.
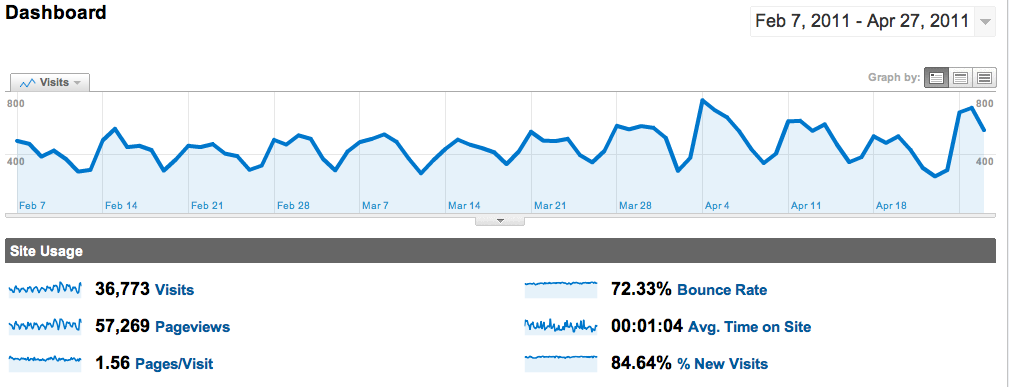
Screen shot of daily readership graph First and foremost, the Analytics tool will give you cold, hard numbers. You can track the number of visits, the time spent on the site, and whether the vistitors are unique or repeat customers. We have between 300 and 800 visits per day here at viz., and over 20,000 views each month. While we're pretty happy with these numbers, no self-respecting academic would object to increased readership. So we've been thinking about ways to broaden our audience and make the site more accessible/searchable - even though we've been pleased to discover that our readership stretches well beyond the continental United States.
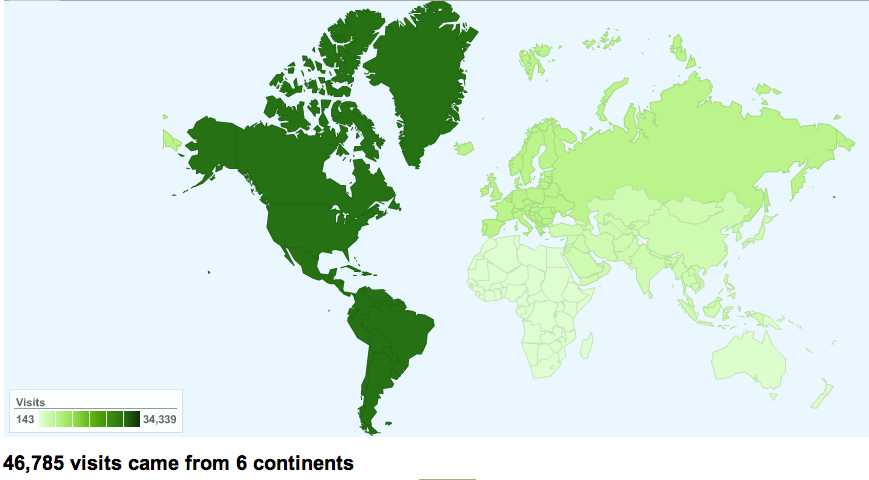
Screen shot of the analytic map of viz. readership's geographic distribution That's another thing Analytics can do - track from where in the world visitors are accessing the site. And, of course, being Google, it gets pretty specific...
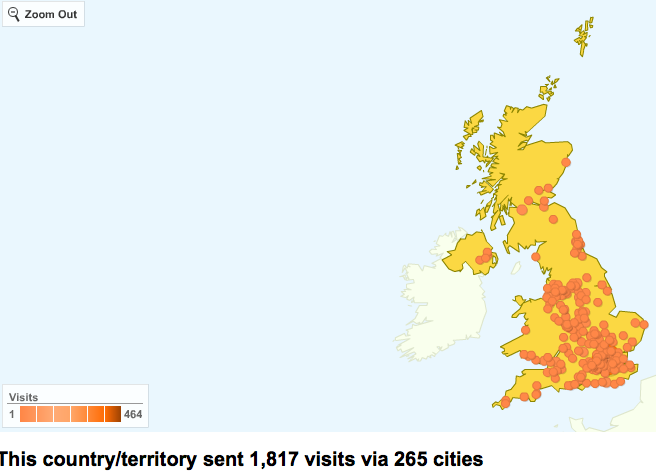
Screen shot of the analytic map of viz. readership in the United Kingdom Analytics will also tell us how people are making their way to the site. One thing we discovered is that our post titles could use some work - Google's search function picks up first on page titles, so the more specific we can be, the more likely it is unique visitors will discover our work. One of our most visited pages, is a post from last February that comes up when people search Google for "Diane Arbus." Analytics will tell us which pages on the site are getting the most hits, and how people are getting there - both in terms of the referring site and the keywords they use to find the page. While it will give us this information for the site as a whole, we can also narrow it down individual pages.
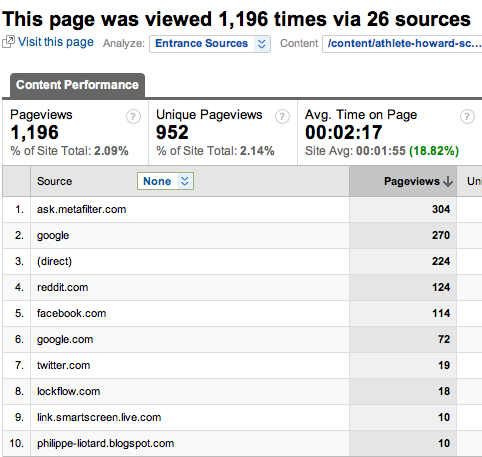
Screen shot of analytics source break-down for Ashley's post on athletes and body images Another one of our top-trafficking pages, Ashley's post on athletes and body images, is garnering attention from a wide variety of sources. While we plan to work on increasing our Facebook and Twitter presence, our three most popular pages (at present) are an interesting indication of the ways in which we can better shape our content.
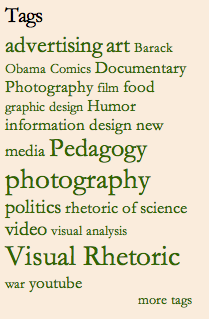
You may (or may not) have noticed some tweaks we've made to the page this semester, and we've got plans in the works for a more significant overhaul next year. One thing we did was move our tag cloud to the upper right hand corner of the page. As a result, one of our top three most visited sites is the page hosting blog posts tagged as "political cartoons." We've become much more conscientious of tagging this semester, especially given Noel and Megan's work with the Steve-in-Action project, investigating the connections between composition and social tagging. We also made it easier for readers to re-post articles by adding this widgit at the bottom of every page. We've seen some great results in terms of traffic from Facebook, Twitter, and other social networking sites where people are sharing our work. While perhaps this shouldn't have been as surprising as we found it, visitors are accessing the static content of the site more than we had realized. Our teaching and visual theory pages are apparently being used fairly regularly, so we plan to continue to update those resources and make them even more useful. In the four months since we began tracking this information, the launch page for visual theory has receieved nearly 1,000 visits - not bad, but it could be better. Did you even know we had a theory page available? It's in the menu bar at the top of the page, along with the teaching link that will take you to lesson plans our contributors have generated over the years, and the views link that hosts various interviews we've conducted with photographers, game designers, and other visual rhetoricians. We've got plans to revamp these pages next year, starting with the teaching page. Aside from our daily visual analyses, we plan to bring you more (specifically) pedagogically applicable content. It's been a good year here at viz., and we're glad to know a bit more about who's out there. Thanks for reading, and we'll see you again soon! |
TagsRecent comments
|
Comments
Correction
Should hit 250,000 unique visits in next 1-2 weeks (I forgot to add in data from before the URL changed from our original one, which was different).
250,000
According to my data, Viz. should receive its 250,000th UNIQUE visitor within the next 4-6 weeks, assuming current trends continue (perhaps longer, as traffic historically drops during summer).
Google Analytics
I'm surprised that y'all put on analytics so recently. I have analytics data going back to when John and I created the site. I imagine that he, knowing John Jones, has it too. If you need it for anything, we can export it to you.