viz.
Visual Rhetoric - Visual Culture - Pedagogy
Site informationRecent Blog Posts
|
The Image of the City, Revisited: MIT’s Place Pulse Project
Submitted by Lisa Gulesserian on Sun, 2012-05-06 09:00
Image Credit: MIT's Macro Connections Group Last week, as my students in my Rhetoric of Suburbs & Slums class presented their final movie projects, I was reminded of how we often judge a place after only a cursory glance. One group project especially got me thinking: “The Divide,” a student-made film that explored the differences between East and West Austin, included many images from East and West Austin along with candid interviews of residents from both sides of the divide. My students’ video reminded me of MIT’s Place Pulse project, which in turn reminded me of Kevin Lynch’s seminal urban planning book from 1960, The Image of the City. As a culmination of my time blogging about cities the last few months on viz., I’m going to talk about “imageability” and intimacy in Austin (and beyond). As coined by Kevin Lynch, “imageability” is “that quality in a physical object which gives it a high probability of evoking a strong image in any given observer. It is that shape, color, or arrangement which facilitates the making of vividly identified, powerfully structured, highly useful mental images of the environment.” An “imageable” city is one that is readily identifiable by its landmarks and landscape. Connecting “imageability” to our daily lives, we make decisions on where to go if we’re unfamiliar with a city by judging what we see in the moment we see it.
East Austin Fence — Image Credit: karenjeanette's flickr In their video, my students interviewed West Campus residents about their views on East Austin. Many of the interview subjects mentioned “chain-link fences” and “refuse” as they were describing East Austin. My students then asked their interviewees if they’d spent much time in East Austin—their answers were often phrased as “No, because it’s unsafe.” Seeing chain-link fences and trash was a deterrent for these West Campus students to venture across I-35 (no matter that the city’s most dangerous areas—in terms of the highest occurrence of murders, aggravated assaults, and rapes—aren’t even on the east side of town!).
But are these visual cues universal? A group of researchers at MIT’s Macro Connections Group has made it their goal to find out with Place Pulse. The group describes the project as “an attempt to generate quantitative data on aspects of cities that are hard to quantify, such as the effect that urban looks have on our perception of a city’s safety or our own perceived level of prosperity. To answer these questions we crowdsource the comparison of pairs of images that show randomly chosen urban landscapes.” When you visit the site, you see two images side by side, then are asked questions like “Which place looks more safe?” or “Which place looks more touristy?” or “Which place looks more livable?” The site is meant to emulate our experiences in unfamiliar places. A chain-link fence on an unknown city street might make us vote for the other place as “more safe.” Or an outcropping of flowers in someone’s front lawn might make us deem it “more livable” than its partner picture. An initial visual cue affects our opinion of a place, and Place Pulse helps track what kinds of cues stimulate specific reactions in urban environments.
Image Credit: Screenshot of Place Pulse The researchers at Place Pulse have been collecting visual cue data for a little less than a year now. They’ve even started to open up their data set (and their site’s visitors) to independent researchers around the world. Now, you can set up a question, along with the types and locations of Google Maps images, to get answered by anyone on the internet.
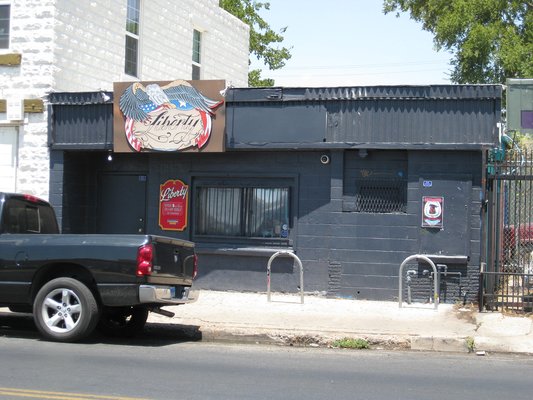
Image Credit: Corbo E. on yelp I’m curious to see what would happen if I were to ask “Which place looks more safe?” for two images of Austin—one of the Drag in West Campus, one of East Sixth Street on the East Side. To those not as intimately familiar with the wonderful trailers, bars, and artists’ studios on Austin’s East Side, the chain-link fence might signal “danger.” To me, that same chain-link fence signals “a perfect place to lock my bike (if the bike racks are already full) while I eat beet fries at the Liberty Bar.” The images of a city are key, but so are our intimate experiences of a place. As Kevin Lynch says: “We are not simply observers of this spectacle [of the city], but are ourselves a part of it, on the stage with the other participants. Most often, our perception of the city is not sustained, but rather partial, fragmentary, mixed with other concerns. Nearly every sense is in operation, and the image is the composite of them all.” At first glance, “image is everything.” But with a closer look, it’s not the whole story. |
TagsRecent comments
|
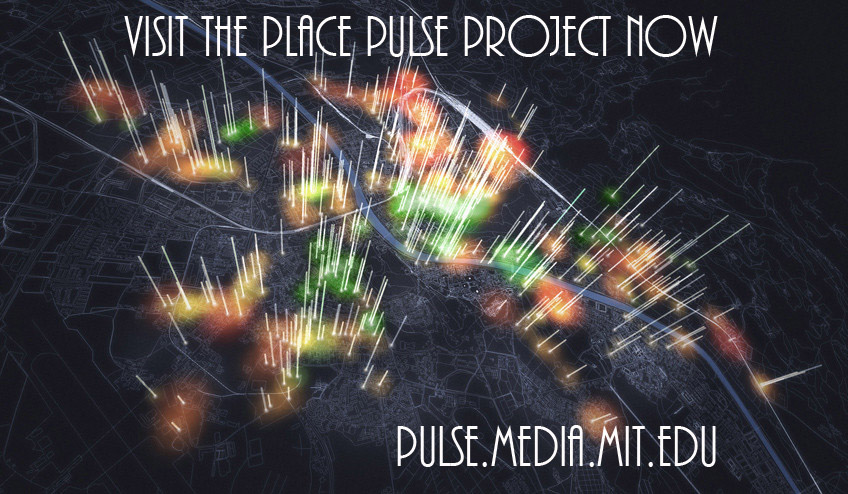
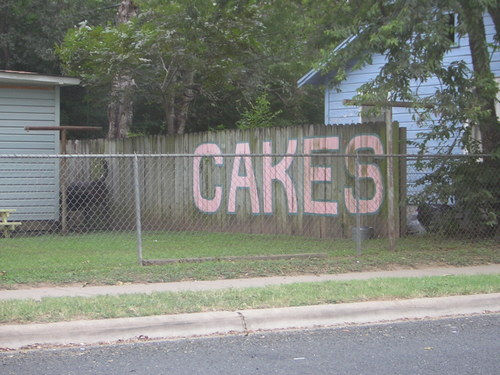
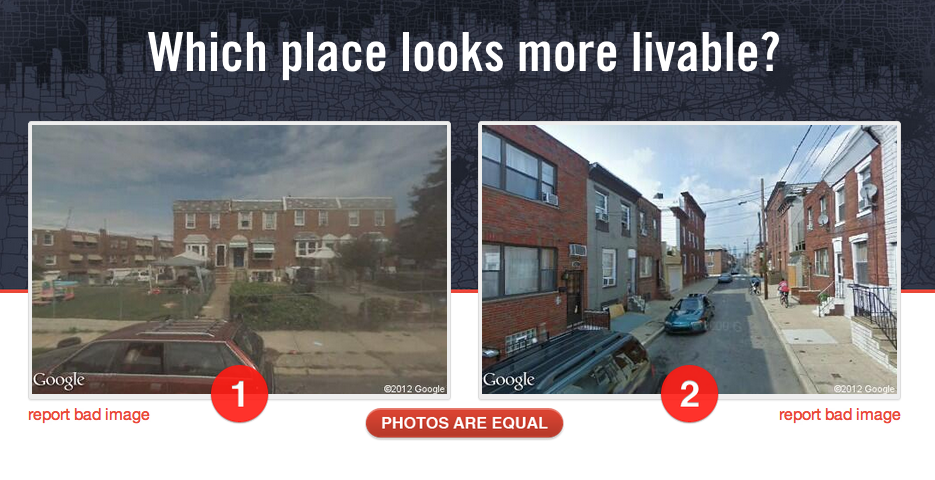 Image Credit: Screenshot of
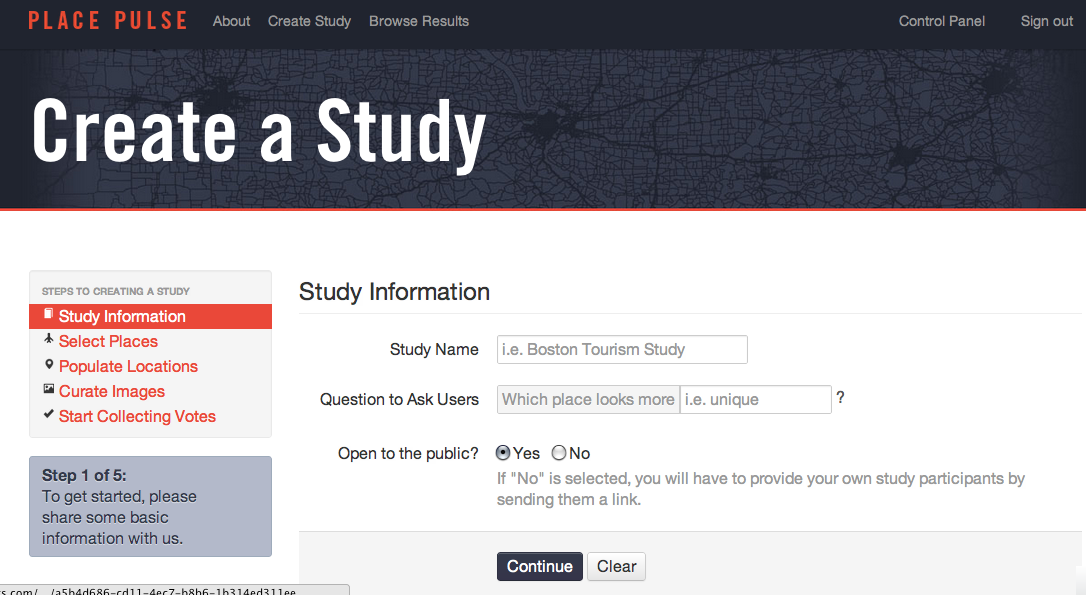
Comments
Awesome projects!
Lisa, this is a great post! Any chance I could see what projects your students did? The East/West Austin video sounds great!