viz.
Visual Rhetoric - Visual Culture - Pedagogy
Site informationRecent Blog Posts
|
GooglemapsGoogle's "Sea View" and Marine Metaphors for the Web
Submitted by Calliope on Thu, 2012-09-27 15:31
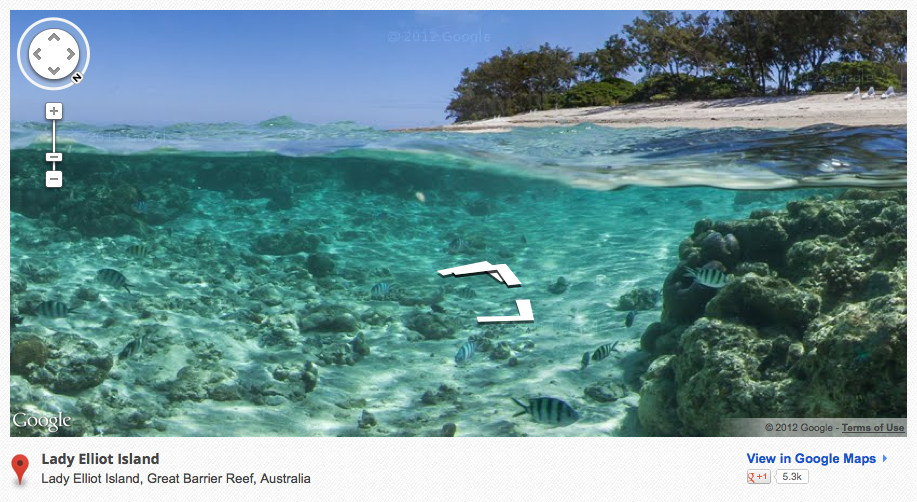
Image Credit: Google Streetview Gallery Google Maps has a remarkable new feature called Sea View that spotlights oceanic life and space. Sea View is essentially the marine version of Street View, a layer of Google Maps that allows users to navigate though 360-degree panoramic images of the Earth's surface. By extending the concept of Street View to the ocean floor, Google has added six coral reefs to the long list of cities, landmarks and parks users can currently explore remotely, from the comfort of their digital devices. The fascinating images captured so far by Google and its partner, Catlin Seaview Survey, bear out the imaginative quality of the overarching project. It's almost as if Sea View is Google's attempt to fulfill a common childhood fantasy: to experience what it would be like to live under the sea. With its zoomable and virtually traversable underwater imagery, Sea View enables adults and children alike to realize this wish (without having to worry about oxygen supply or the expense of travelling to distant coral reefs). The Image of the City, Revisited: MIT’s Place Pulse Project
Submitted by Lisa Gulesserian on Sun, 2012-05-06 09:00
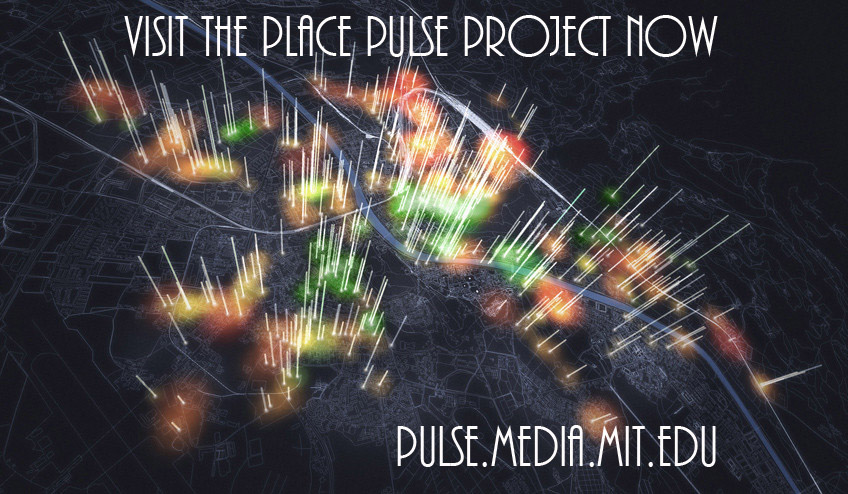
Image Credit: MIT's Macro Connections Group Last week, as my students in my Rhetoric of Suburbs & Slums class presented their final movie projects, I was reminded of how we often judge a place after only a cursory glance. One group project especially got me thinking: “The Divide,” a student-made film that explored the differences between East and West Austin, included many images from East and West Austin along with candid interviews of residents from both sides of the divide. My students’ video reminded me of MIT’s Place Pulse project, which in turn reminded me of Kevin Lynch’s seminal urban planning book from 1960, The Image of the City. As a culmination of my time blogging about cities the last few months on viz., I’m going to talk about “imageability” and intimacy in Austin (and beyond).
What would Proust do with Google Maps?
Submitted by Jake Ptacek on Tue, 2011-11-15 09:00
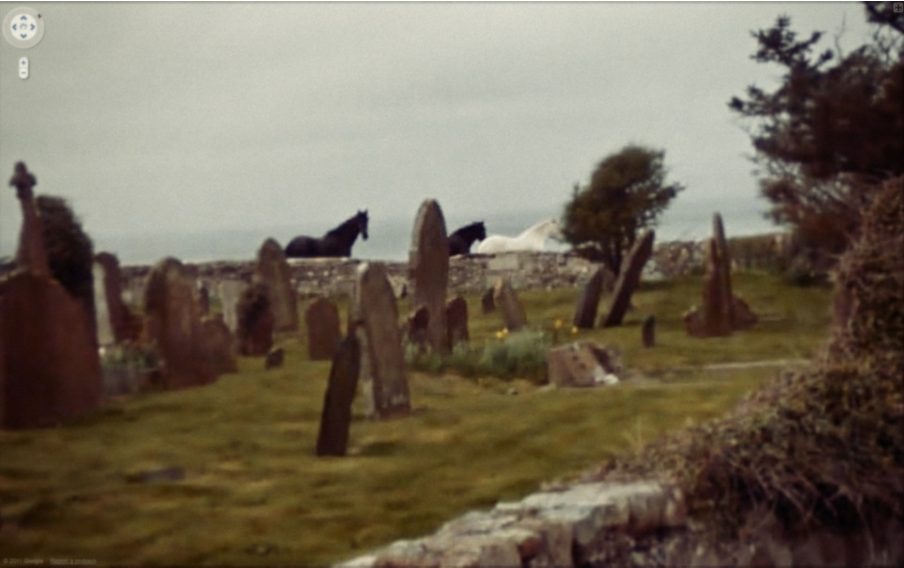
Screenshot from Google Maps via Jon Rafman In David Sasake's blog post, "How to read Google Earth like Proust," he notes that Marcel Proust liked to read train timetables before bed. According to Alain de Botton, "[T]he mere names of provincial train stations provided Proust's imagination with enough material to elaborate entire worlds, to picture domestic dramas in rural villages, shenanigans in local government, and life out in the fields." Place names can float up in our subconsciousness, rekindling memories long forgotten like rabbits pulled out of a magician's hat. So what would Proust make of Google Maps, and especially Google's massive, ongoing "Street View" function, where an ever-expanding swath of the globe is mapped, photographed, and instantly accessible? What happens when you can view almost anyplace, anytime? Google Maps Assignment by Sean McCarthy
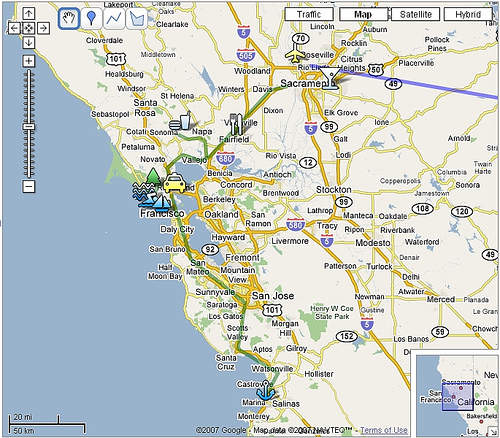
Image Credit: billolen For a handout, download the PDF document outlining this assignment. Objectives: In this assignment, students are asked to create a GoogleMap to map a topic. GoogleMaps allows students to create their own journeys and annotate place markers with text and multimedia content; they can upload their own photos to their map, link to YouTube clips, write text and link to blogs and other kinds of websites. This free service encourages them to build maps that tell stories in a visually interesting, geographically situated way, and all sorts of people, from news agencies to public transportation services, are now using maps to create new kinds of content (commonly called 'mashups'). GoogleMaps shows how fun and creative writing on the web can really be. With no experience and lots of imagination students can join the most creative people currently delivering content on the web. In this assignment students will literally "map" a topic of their own choosing that relates to globalization. In other words, they are going to use the multimedia environment of GoogleMaps to tell their story and present their research to the rest of the class (and the rest of the world, if they wish!). Materials/Equipment: Internet access and a Google Account. Preparation: Students need to be taught how to navigate GoogleMaps. Fortunately, GoogleMaps are really easy to use. These introductory videos will show you the basics. Here’s the page that gives you step-by-step instructions on how to build your map. This YouTube video shows you how to create interactive place markers. Finally, Google Maps Mania is a great blog that shows how people are using GoogleMaps around the world. It provides links to hundreds of maps and is a great place to start thinking about your own map. Procedure: Midterm maps due: week 10/28 Final Map Due: 12/4 Accompanying Paper: due 12/4 Assignment Specifics: The map will be evaluated as a Learning Record work sample. So, be sure to make observations about what you are learning as you are creating your map and use the work samples as a way of building your research. A draft of the map is due the week of 10/28, when we will spend the week on presentations of your maps. The final map is due the last day of class as a work sample in your LR. In addition, you need to produce a two-page, single-spaced explanation of your choices for the map. In this short paper you will explain the idea behind the map—the intended audience, the choice of sources, why you chose that particular layout. etc. My criteria for assessing your map are simple: how well do you use the map technology? How clear is the story you are trying to tell? How do you balance writing in the map with multimedia content? Will this map be useful and legible for your defined audience? Will they understand what this map is about without having been in this class? There are a number of ways you can fill in your map. It must have at least 8 placemarkers that contain text, and some sort of reference to other multimedia resources (photos, hyperlinks, YouTube clips etc). The writing must by your own, though you obviously can use links to other text, audio and visual material to help tell your story. Part of the skill you will develop will be to decide what information to write into the placemarker and what you will leave to your hyperlinked sources. For example, how well can you tell the story within your map without forcing your audience to jump to other websites to fill in the gaps? These are the kinds of important choices you must make. The success of your map will depend on the clarity of your writing, what sources you use and how you incorporate them, and the overall coherence of the project (in other words, can the reader easily understand the whole idea behind the map?). You will need to do some research, but that research could include your own photographs (or photos you find on the web); your own interview or podcast (or one you find on the web), a really cool YouTube clip, or an informative website or blog. Remember, your GoogleMap and midterm paper can be on the same topic, so research for the map can count as an opportunity to develop your research for your midterm paper. The only real rules are that the map must in some way relate to the ideas we are talking about in class. It must be informative (in other words, it shows research) and there must be writing to assess. DON’T present me with just a bunch of photos or hyperlinks; it’s how you write about them that counts. Presentations will be on the week of 10/28. The feedback you get from the class during these presentations you will be able to clarify your ideas and build a better map. After the presentations you will buddy with two other classmates. For the rest of the semester, you will be helping each other evaluate your maps using the map rating function built into GoogleMaps. Critical Cartography: Aram Bartholl's "Map"
Submitted by Lisa Gulesserian on Thu, 2011-09-22 08:00
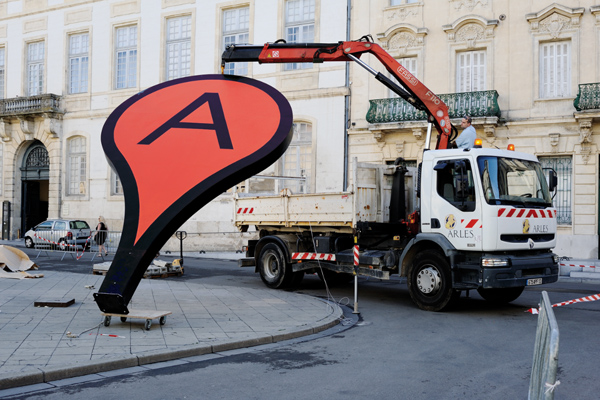
Image credit: Aram Bartholl's "Map" Google Maps is a godsend—in our daily lives, we use the site to find a new place to live, track the settings of a public controversy, catch lawbreakers in the act, and claim land that’s been long-contested. Border scuffles and all, Google Maps is helping us reimagine the terrains, cities, and spaces of the real world. It was only a matter of time before we witnessed the melding of Google Maps virtual and Real World spatial. That time is now: Berlin-based artist Aram Bartholl has spent the last five years working on a project that brings Google Maps’ digital location markers into real city spaces. His installations in different cities in Europe and Asia—all entitled “Map”—ask us to question the lines between real and virtual, center and periphery.
Tags:
Street View Art
Submitted by catherine_c on Tue, 2010-11-16 22:10
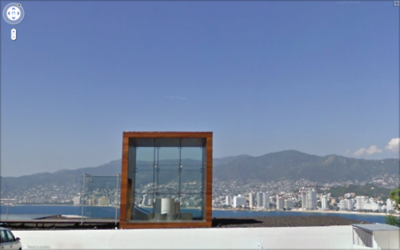
Image Credit: Apres Garde, by way of Google Maps Mania The above image is the Saturday, November 13th entry from the Tumblr photo blog of local writer Matt Bucher, Apres Garde, where he collects picturesque images from Google Street View. Apres Garde is one of several Google Street View art sites featured on Tuesday by the Google Maps Mania blog along with Montreal-based artist Jon Rafman's 9 Eyes Tumblr which presents a mixture of scenic views and interesting or suggestive situations captured by the Google Street View Camera alongside Lehel Kovács Google Street View inspired cityscapes and Bill Guffrey's Virtual Paintout. All of these blogs use the images captured by Google Maps street view as (or for inspiring) their work.
Tags:
|
|
Recent comments
2 years 29 weeks ago
2 years 44 weeks ago
2 years 44 weeks ago
2 years 50 weeks ago
3 years 4 weeks ago
3 years 4 weeks ago
3 years 4 weeks ago
3 years 6 weeks ago
3 years 6 weeks ago
3 years 6 weeks ago