viz.
Visual Rhetoric - Visual Culture - Pedagogy
Site informationRecent Blog Posts
|
income inequalityVisualizing the Economy and the Rhetoric of Infographics
Submitted by Michael Widner on Tue, 2011-04-12 07:30
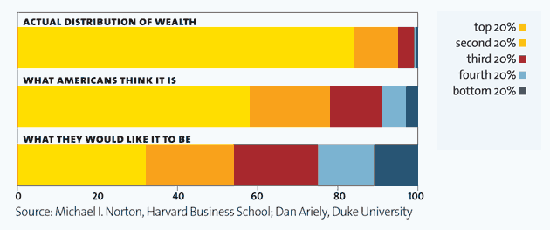
via Mother Jones, "It's the Inequality, Stupid" Infographics can provide visual drama and emotional impact to otherwise incomprehensible and dry numbers. As Ladysquire's recent post on The 12 States of America demonstrates, they can be particularly good at capturing income inequality. The image from Mother Jones above is another nice example of the striking disparity among Americans' perception of wealth distribution, what they wish it were, and what it actually is. The 12 States of America
Submitted by ladysquires on Thu, 2011-03-17 09:00
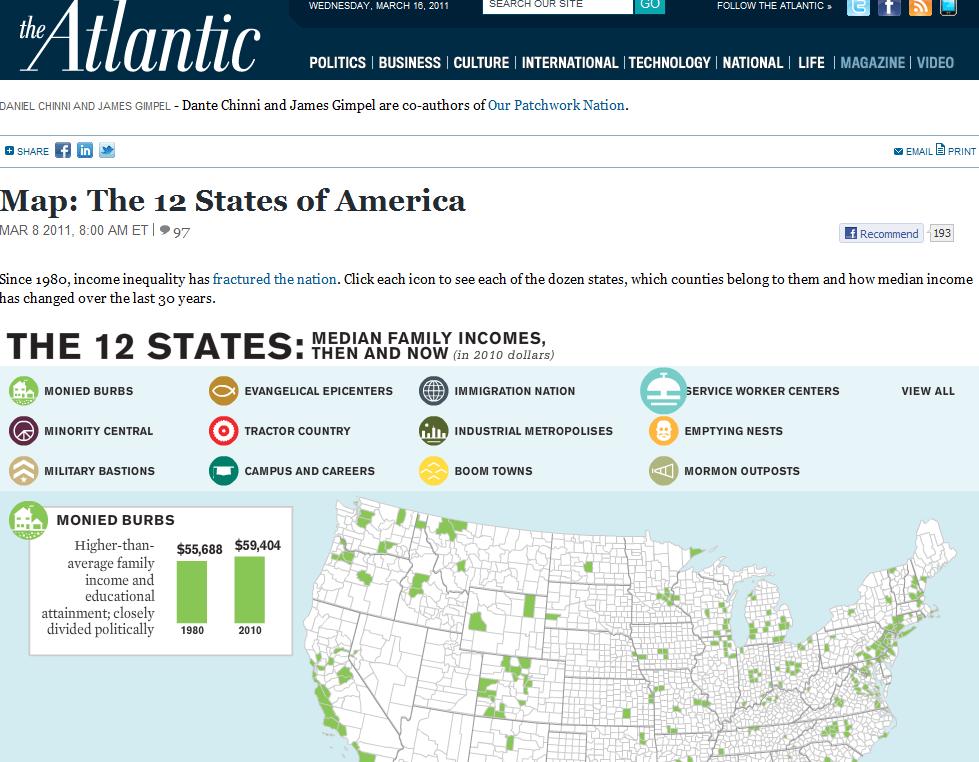
(Image Credit: The Atlantic) I adore interactive maps, especially ones that come in sexy colors and with a wealth of demographic data. The Atlantic has a new one up by Dante Chinni and James Gimpel, authors of Our Patchwork Nation, that juxtaposes demographic data for individual counties and the rise or fall in average incomes. Chinni and Gimpel use these relationships to identify twelve "county types," each of which have some relationship to a demographic data point and a rise or fall in income. Seven of the county types have seen a decrease in effective income (adjusted for inflation) between 1980 and 2010.
Tags:
|
|
Recent comments
2 years 29 weeks ago
2 years 44 weeks ago
2 years 44 weeks ago
2 years 50 weeks ago
3 years 4 weeks ago
3 years 4 weeks ago
3 years 4 weeks ago
3 years 6 weeks ago
3 years 6 weeks ago
3 years 6 weeks ago