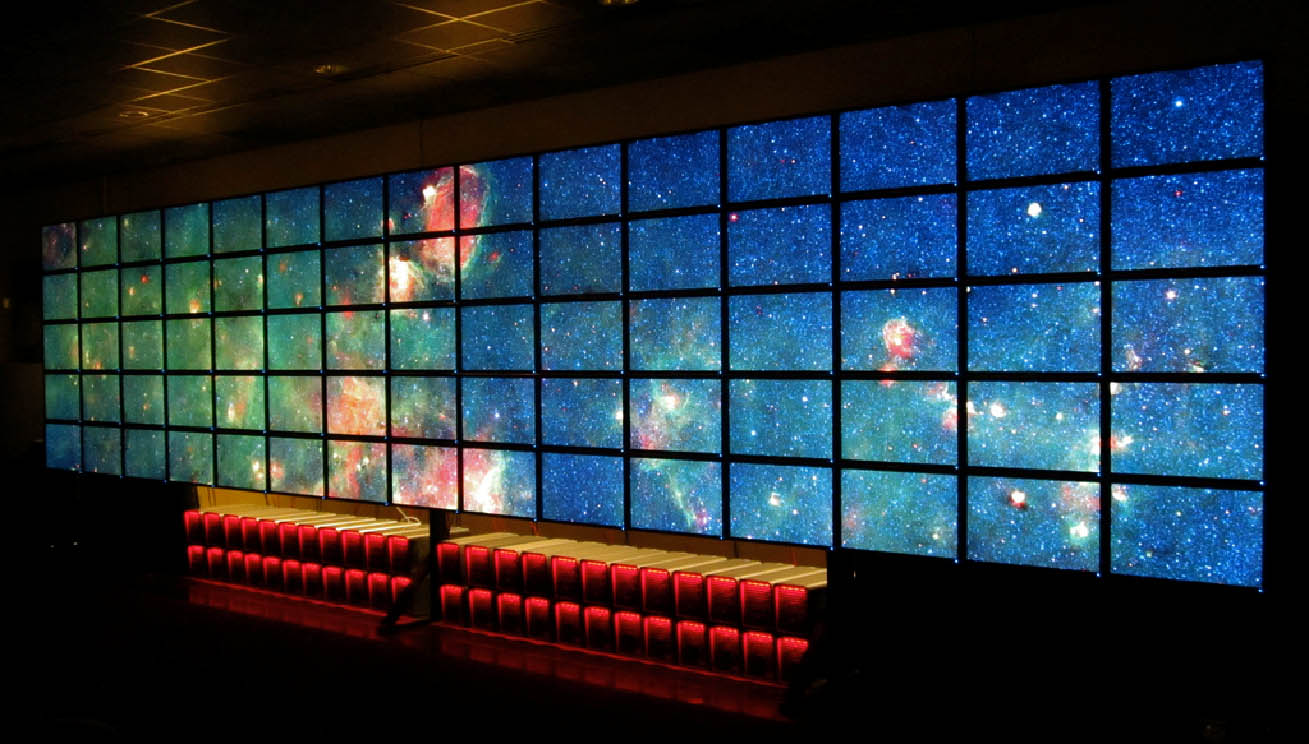
Image Credit: TACC H / T to Scott Nelson
In my very first post for viz., I marveled at Ben Fry’s visualization tool The Preservation of Favoured Traces, which helps us to visualize Darwin’s revision of Origin of Species over six editions. With a background in computer science, statistics, and graphic design, Fry had managed to approach the problem of visualizing textual history with striking economy and elegance. In my post, I wondered about the unorthodox solutions (and research questions) we might discover if we engaged in digital collaborations with designers and engineers. This question resurfaced yesterday as I toured the visualization lab at UT’s Texas Advanced Computing Center (TACC).
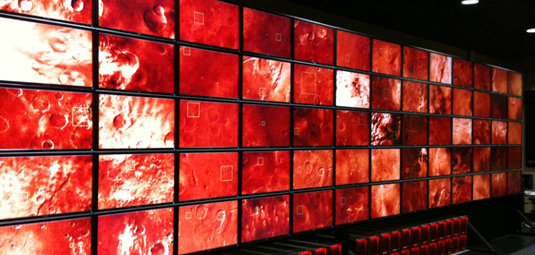
The centerpiece of TACC’s visualization lab is the world’s highest resolution tiled-display (at 307 megapixels), a 15 screen x 5 screen array of 75 30-inch flat panel monitors named Stallion. (All of the equipment has a Texas-kitsch moniker: e.g., Rattlesnake, Mustang, Horseshoe.) Other areas of the lab included a 20 x 11-foot flat screen mini-theater and an 82-inch 3D back-projection display. A partitioned collaboration room allows small groups to develop visualizations.
On our tour, we viewed samples of both art projects and scientific simulations that reinforced how (to quote the TACC web site) “visualizations generated by supercomputers can immerse you in data, visually.” Upon entering the darkened space, we were confronted with photographer Ricardo Meleschi’s one giga-pixel panoramic image of downtown Austin; a controller allows visitors to zoom in on a street sign or the inside of an apartment with remarkable (and rather invasive) clarity. The lab has also hosted two digital art exhibitions. Of the art pieces we viewed on Stallion, my favorite was one by Bill Haddad that riffed on the security-camera set-up of the monitors, offering faux surveillance footage of campus buildings and outdoor spaces manipulated to look like it was being taken in real-time. Clearly, though, collaborations with scientific researchers have been the lab’s focus: for example, we saw simulations that predicted, respectively, the path of Hurricane Ike and the patterned spread of the H1N1 virus in the U.S.

Image Credit: TACC H / T to Scott Nelson
As an instructor, I can be admittedly dinosaur-like, feeling that we should be clear on our pedagogical goals first before considering the technologies that enable us to achieve them. But as I stared at a sophisticated molecular model out of a pair of fancy 3D glasses embedded with a microchip, my techno-skepticism vanished, and I wondered why the chemists should have all the fun. When I asked Visualization Lab Manager Brandt Westing if the lab had worked with researchers in the liberal arts, he responded that this was a population the lab would love to collaborate with but that it was difficult to get the word out. All UT faculty, staff, and students have access to the visualization lab, which includes extensive training and support from TACC staff. Maybe we should just start dreaming up projects, albeit necessarily clunky and unsophisticated ones at first, and use the technology to see new questions and patterns?
Ultimately, though, my visit to TACC’s visualization lab raises larger questions than whether or not one absolutely needs to use supercomputers to do research in rhetoric, writing, and literature (the answer, alas, is probably “no”). More broadly, the lab is a high-tech space that invites us to think about the role that visualization (even if unabashedly low-tech) might have not only in presenting our research but also generating and investigating our research questions.
Comments
Visualization and Technology for Liberal Arts
We enjoyed having you and your class in the lab last week. We make great efforts at TACC to reach out to emerging computational communities of users in the humanities, arts and social sciences while simultaneously maintaining support to our core users in science and engineering. Visualization as a field is evolving at a rapid pace, and while it was initially limited to scientific visualization, it has grown to include information visualization and artistic visualization as well. Programming languages such as Processing (processing.org) have even been developed to enable the creation of interactive visualizations without the need for a formal engineering or science background. With so much technology at our fingertips, your question is extremely valid: "Do you need supercomputers and high technology to do research in rhetoric, writing, and literature?"
From our point of view at TACC, the answer to that question is a resounding "Yes!" That is probably what you would expect from an advanced computing center, but the reality is that technology can allow the exploration of data at a resolution and clarity not possible otherwise. It allows insight and enables new ways of thinking. Even during your class last week when I demoed multiple video sequences simultaneously on the Stallion Tiled-Display, students in your class began to recognize patterns in the videos that would not have been noticed otherwise. I admit I didn't notice them, and if I had, I probably wouldn't have realized the significance of it - but your students did. With students like yours and those from fine arts, humanities, film, and architecture among others working with scientists and engineers from TACC the possibilities that arise are interesting, but also remain largely unknown. How can students from humanities and liberal arts get started using the lab? Perhaps you said it best: "Maybe we should just start dreaming up projects, albeit necessarily clunky and unsophisticated ones at first, and use the technology to see new questions and patterns?" Our goal at TACC is to power and enable discoveries with advanced technology. We attempt to stay current with cutting edge technology and work to support the academic community in any endeavor or academic discipline. So feel free to come to us with your projects. Who knows what discoveries can be made and what insights can be gained?
Brandt Westing - Research Engineer - Texas Advanced Computing Center