viz.
Visual Rhetoric - Visual Culture - Pedagogy
Site informationRecent Blog Posts
|
Reply to commentBetter Living Through Visualization
Submitted by emcg on Wed, 2010-10-20 18:24
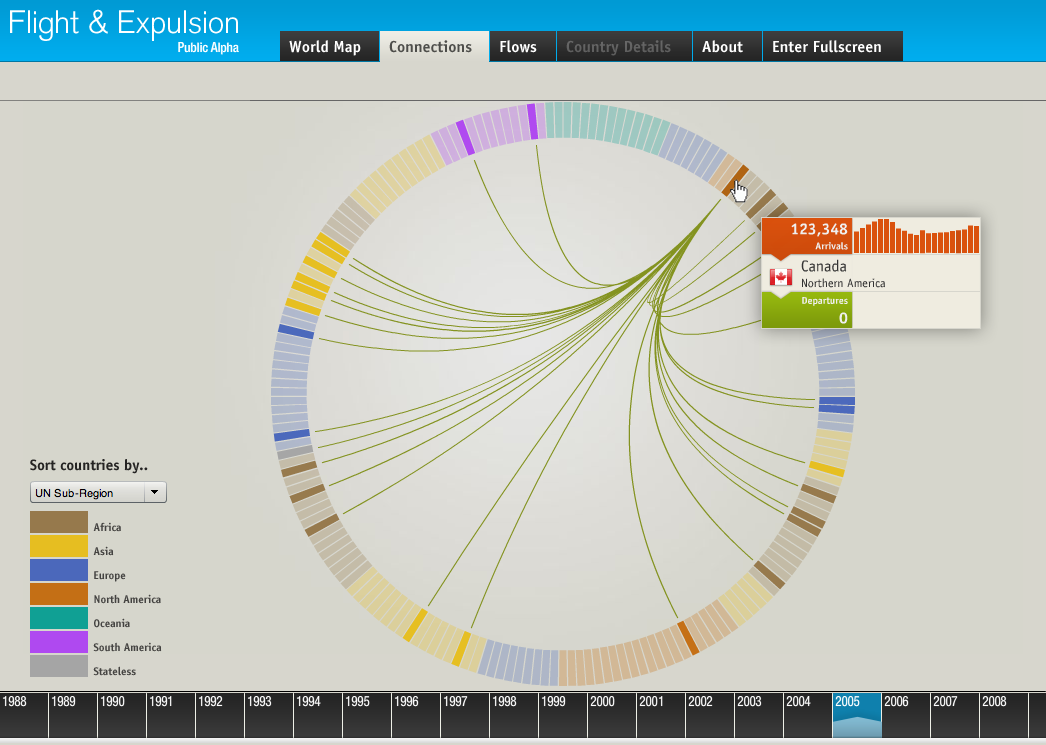
Image Credit: Christian Behrens, "Flight & Expulsion" On the heels of touring the Texas Advanced Computing Center’s visualization lab, I thought I’d highlight a new social-media platform for data visualization. Launched earlier this month by GE and SEED Media Group, visualizing.org is a collaborative space for visualizing complex issues like climate change, human migration, and food insecurity. As the editors explain, “The site is open and free to use. Everything you upload remains your sole and exclusive property and is licensed under a Creative Commons Attribution Non-Commercial Share Alike License. Simply put, this means that anyone can share, copy, remix, or build upon the visualization as long as: (i) it is used non-commercially; and (ii) the visualization’s creator and source are credited.”
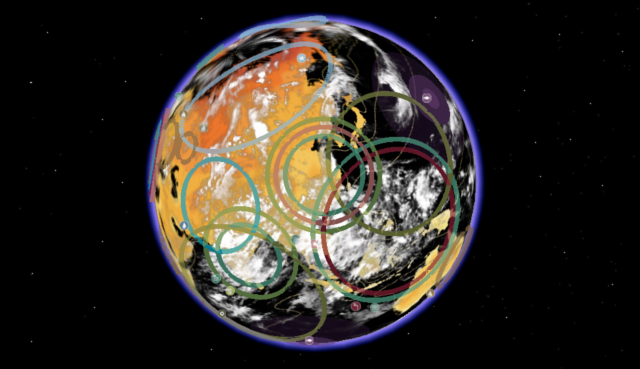
Image Credit: U.K. Government Given the open-source nature of the site, offerings are necessarily uneven or idiosyncratic. For instance, while browsing, I encountered a playful series of vampire venn diagrams and a fanciful but enigmatic visualization titled, in all caps, “A_B_ PEACE & TERROR ETC. THE COMPUTATIONAL AESTHETICS OF LOVE & HATE.” However, the content curated by the site’s bloggers is so far consistently intriguing. They highlight innovative visualizations such as the UK’s new Google Earth layer to predict the effects of climate change and Christian Behrens' work on migration, which uses the same data set to generate several different visualizations, calling our attention to the function of graphic design in guiding our way of seeing.
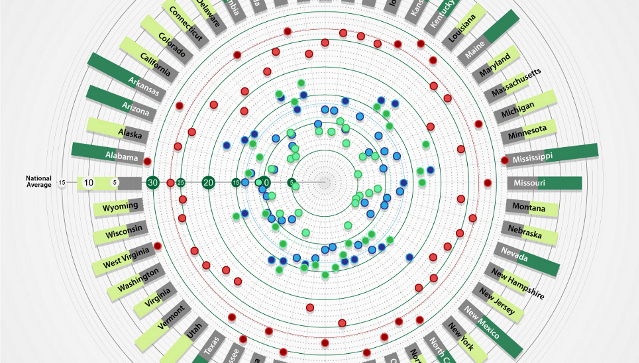
Image Credit: Cause Shift, "Food Insecurity, Obesity, SNAP Participation and Poverty" In addition to providing visualizations for classroom analysis, visualizing.org offers a space for students to share their own image productions, perhaps even the infographics that Cate contemplates in her latest post. Of course, the hard work of constructing and supporting such an assignment still remains, but the site would provide opportunities for students to get feedback from a larger community of graphic designers, beyond what an individual instructor can offer as an “infographics noob” (to borrow Cate's expression).
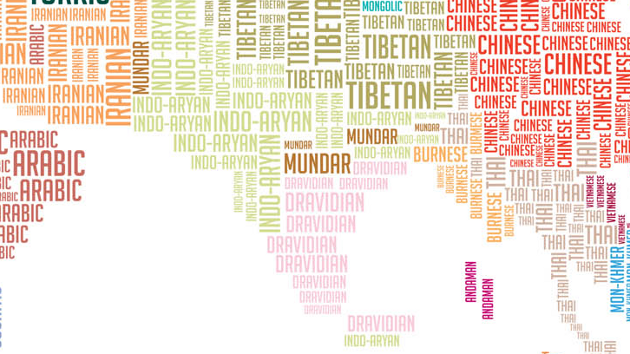
Image Credit: Rozina Vavetsi, "Languages of the World" The site's rhetoric is perhaps over-optimistic, promising pie-in-the-sky social change via open-source pie charts: “By giving visual form to the often abstract systemic underpinnings that lie between broad concerns like health, energy, and the environment, we hope to generate actionable knowledge that can be used to improve lives.” Nonetheless, visualizing.org is an easy-to-use and potentially powerful platform for collaborative, interdisciplinary approaches to visualization. At the same time, its open access allows us to add to the current science-and-society agenda: how might we visualize data related to our interests in English, rhetoric, and composition studies? ReplyYour contribution to the blog: Please Read Before PostingThe viz. blog is a forum for exploring the visual through identifying the connections between theory, rhetorical practice, popular culture, and the classroom. Keeping with this mission, comments on the blog should further discussion in the viz. community by extending (or critiquing) existing analysis, adding new analysis, providing interesting and relevant examples, or by making connections between that topic and theory, rhetoric, culture, or pedagogy. Trolling, spam, and any other messages not related to this purpose will be deleted immediately. Comments by anonymous users will be added to a moderation queue and examined for their relevance before publication. Authenticated users may post comments without moderation, but if those comments do not fit the above description they may be deleted. |
|
Recent comments
2 years 29 weeks ago
2 years 44 weeks ago
2 years 44 weeks ago
2 years 50 weeks ago
3 years 4 weeks ago
3 years 4 weeks ago
3 years 4 weeks ago
3 years 6 weeks ago
3 years 6 weeks ago
3 years 6 weeks ago