viz.
Visual Rhetoric - Visual Culture - Pedagogy
Site informationRecent Blog Posts
|
Reply to commentThe economy and design
Submitted by John Jones on Thu, 2008-12-11 13:24
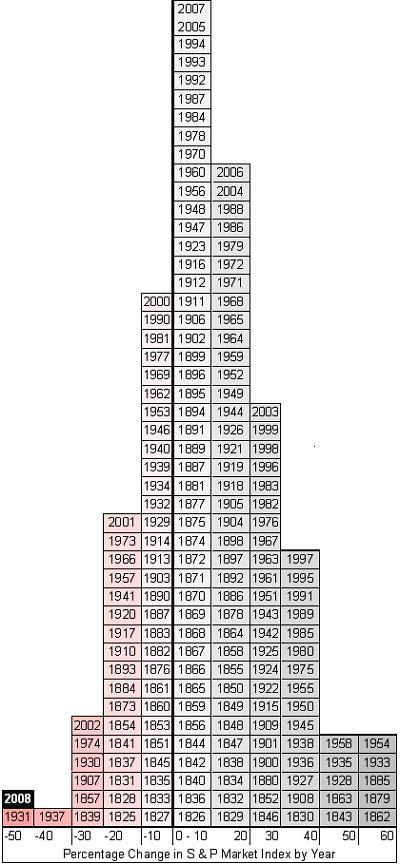
I saw these two responses to the our recent economic woes on BoingBoing. The first, posted by guest-blogger Clay Shirky, is a graph showing the distribution of the returns of the S&P 500 in 10-percentage-point increments since 1825. The placement of 2008 adds a chilling perspective to our current crisis.
The second is a humorous response to the proposed auto industry bailout in the form of a car advertisement:
ReplyYour contribution to the blog: Please Read Before PostingThe viz. blog is a forum for exploring the visual through identifying the connections between theory, rhetorical practice, popular culture, and the classroom. Keeping with this mission, comments on the blog should further discussion in the viz. community by extending (or critiquing) existing analysis, adding new analysis, providing interesting and relevant examples, or by making connections between that topic and theory, rhetoric, culture, or pedagogy. Trolling, spam, and any other messages not related to this purpose will be deleted immediately. Comments by anonymous users will be added to a moderation queue and examined for their relevance before publication. Authenticated users may post comments without moderation, but if those comments do not fit the above description they may be deleted. |
|

Recent comments
2 years 29 weeks ago
2 years 44 weeks ago
2 years 44 weeks ago
2 years 50 weeks ago
3 years 4 weeks ago
3 years 4 weeks ago
3 years 4 weeks ago
3 years 6 weeks ago
3 years 6 weeks ago
3 years 6 weeks ago